[Link back toSite Analysis; Link back to Permaculture Journey]
This sector map for Barbolian Fields was drawn in Inkscape, an open-source drawing software. For anyone reading this wondering how to accomplish this task, here was my method:
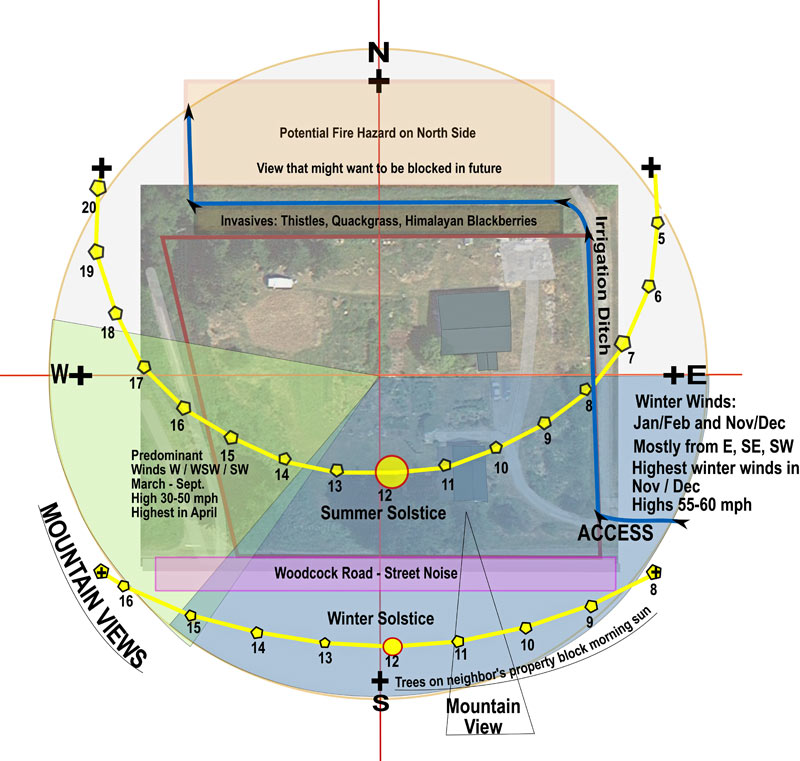
I first imported a Google map of the property onto a base layer. Over this, I outlined the property boundaries in red and drew North-South / East-West lines for points of reference. I also drew a circle around the drawing to give additional points of reference.
Next, I imported specific maps of the paths of the sun on the winter and summer solstices over Barbolian Fields (from Sun Earth Tools). Because these maps track the sun over a much larger area, they needed to be scaled to size to fit the project site. The north-south/east-west lines helped immensely with this task – just line them up with the cross-hatches on the solar map and scale accordingly. As can be seen, they correctly show where the sun rises in summer just after 4:00 a.m. (we sometimes camp outside in the summer — I wasn’t hallucinating — it really was rising in the NE!), and where it set behind the trees to the NW shortly after 8:00 p.m.. The program also effectively depicts the winter sun, which crosses much lower in the sky, and as noted, does not rise above the trees on the neighbor’s property until almost noon. It goes behind the mountains by about 4:00 p.m. To add the solar pathways to the sector map, I imported the Sun Earth map, created a layer on top of it, drew over the lines that outlined the sun’s trajectory, and then deleted the imported file beneath (which included images beyond our focus area). I did this with each of the maps for summer/winter; again, lining up the N-S/E-W lines was important to getting the proper trajectory and scale for the two times of year.
Another layer was created to illustrate prevailing winds in winter and summer. Although it appears that there is much more wind in winter, just by the greater size of the blue-shaded area, actually, winter winds only span 4 months: November, December, January, and February. Winds during this time can vary depending on the jet stream and influences in other parts of the country. For the greater part of the year, however, March through September, the prevailing winds are off the Pacific Ocean to the west. Not everyone keeps data on the wind (most records look at precipitation and temperatures); however, we are fortunate to have a good tracking system at the Dungeness Lighthouse. Although the winds there tend to be a bit stronger than at the Barbolian Fields site, they are still coming from the same direction.
An additional layer was created for “other considerations”: road access, noise pollution, fire hazards, views (both good and bad), where the irrigation ditch runs, and from where the most pervasive noxious weeds are most likely to invade.
We saved the file, imported it into Photoshop, flatted the layers, reduced the size, and saved it to an image that could be uploaded to a website. Done!
If anyone needs help with this part of the design process, feel free to send me an email. I admit, it was a bit of a learning curve for me!
Comments are closed.