Happy New Water Year!
In hydrologist circles, the new water year starts the first of October. It makes sense; that is when the rains return.
So much of our lives revolve around the weather – and it seems this is more and more true. I am not a meteorologist, nor a hydrologist, but I do find following the weather and understanding the water cycle extremely interesting.
Our local weather is complicated. It can vary drastically within just a few miles, from the readings at the lighthouse (close to where we live; our wind levels are similar, but our temperatures are both warmer and cooler), to in the city of Sequim proper (5 miles away; much more sheltered, less wind, and a good 5 degrees or more warmer; their fruit trees bloom a full week earlier than ours). A few miles farther into the foothills will see a lot more rain and snow. In our region, we can vary from 16” of rain in Sequim to 110” in Forks, WA, just 75 miles away. Go up into the mountainous areas of the rainforest, and you will experience closer to 200 inches.
When you look at all these data, it seems we’re all over the place. And we are. It becomes all the more important to understand the microclimate in which we live.
Our water availability is contingent on 3 factors: what falls from the sky, the snowpack stored in the Olympic mountains, and the conservation measures we take to use, re-use, and hold on to every drop we can. We pay close attention to what is happening in the Dungeness River, a short walk from our home. It is a rapidly changing river, rising and falling with the rains and melting snow. Our irrigation water, extracted from the river and routed through a network of over 300 miles of ditches, is turned on in mid-April and shut off in mid-September to leave adequate water for the salmon returning to spawn.
At our home site, we take a daily reading of the rainfall and enter it into the CoCoRaHS database, which is the Community Collaborative Rain, Hail, & Snow Network, sponsored by NOAA and the NFS. The network provides a citizen-based interactive map of weather data all across the country, in Canada, and in the Bahamas. We are one of 10 stations in the Dungeness River watershed, which covers close to 200 square miles.
The 2019 Water Year in Review
My question, though, was how do all these factors (wind, temperature, and precipitation) interact and what is the resulting effect on the garden? It’s one thing to have a gentle drizzle that keeps things cool and moist but doesn’t amount to much, and quite another to have the wind whip through and leave everything broken and parched in its wake. I decided to go through the water year month-by-month, look at the combination of weather conditions, and try to make better sense of what the plants were dealing with. The exercise was very revealing.
Although the actual data might not be relevant to many of my readers, perhaps the process of looking at these interacting factors to better understand your own microclimate might inspire you. From there, we can better determine what measures we can take to better deal with the ups and downs of gardening during these times of climatic turmoil.
* * *
[su_row][su_column size=”2/3″]
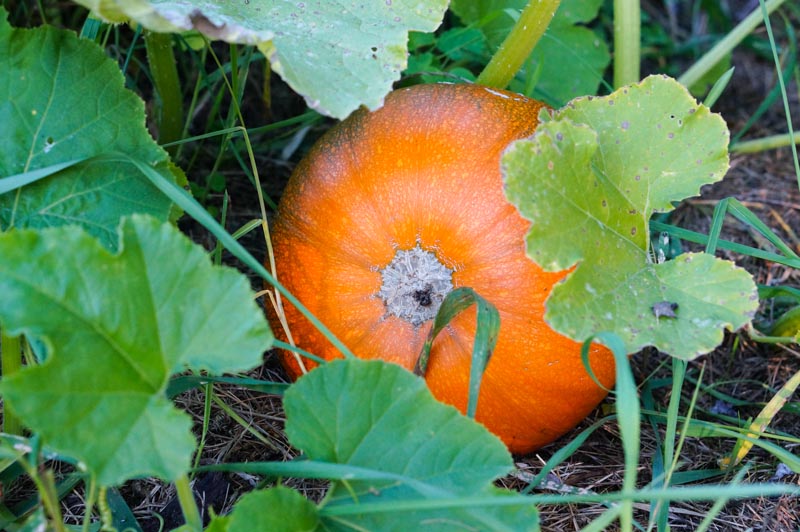
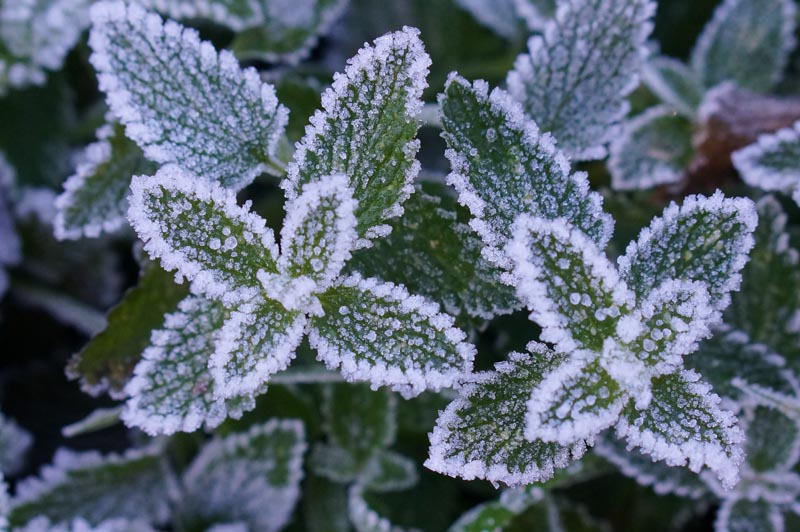
October: The snowpack melted out early over the previous season, leaving the river at a low point of just 77 cfs (cubic feet per second). The temps actually hit 65 degrees! Wow! But we also had our first light frost on October 4. We received 1.77” of rain, which was slightly above the 30-year average of 1.46” in our area. We needed all the rain we could get at this point.
This was a difficult month for us as we found out the casing on our old well was crumbling and we were going to need to dig a whole new well, buy a new pump and pressure tank, and install new water lines. Water issues were front and center for us.
November: The river flow went from below normal in September and October to a rapid 1769 cfs in late November, according to the USGS river gauge. Most of the snow melted in the mountains and rushed out to sea. We had some warm moments, hitting almost 60 degrees, which was outright weird. Normally for November, we would be in the mid-40s. Rainfall was about normal, but the winds topped 50 mph at times. A very tumultuous month!
December: After the last few months, very little snowpack remained in the mountains, which was quite disconcerting. After all, it was December! Accumulated rainfall at our house from October through December was a little over 7 inches, which was about normal. Although there would still be time for snow to accumulate, many were talking about more drought conditions ahead. It actually got up to 59.8 degrees. Nice, but not helpful.
January was dry and windy, with gusts reaching 58 mph, the strongest for the entire water year. Our precip measurement was only 1.45 inches, well below the 30-year average of 2.16.
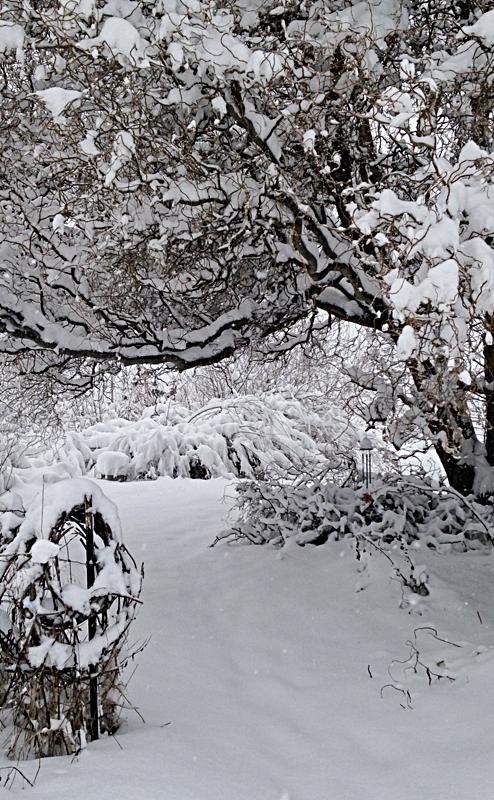
February made up for lost time, with temperatures dipping down to 15 and highs averaging about 40. Winds roared through at 45 mph, and in addition, we got dumped on with 20.2 inches of snow. It stuck around for a long time and everything pretty much came to a standstill. At least we got some much-needed solid snowpack in the mountains. The river, meanwhile, was running low, which meant nothing was melting. (Whew!)
March was dry and warm! At a time to accumulate snowpack, we were losing what we had gained. We received just over ½” of rain when normally we’d get closer to 1.5”. Temperatures were crazy, climbing to over 70 degrees (104 in the greenhouse! Yikes!! Open the doors and windows!). Fruit trees were tricked into thinking it was already spring; early flowering and shoot growth could mean early kill. Winds were lighter than normal for this time of year. We warily enjoyed it.
April: Another unseasonably warm month; average rainfall; wind gusts reaching almost 50. According to one record, 32% of our days during April had wind gusts over 25 mph. The worry is that normally, by the end of April, the majority of the snowpack in the mountains is all we’re going to get; we are unlikely to gain much more until October.
May: Drought was officially declared by Governor Inslee for our region and 26 other watersheds across the state. “There are two factors considered for any emergency drought declaration: Water supply conditions that are currently or projected to be at or below 75 percent of average, and a projection of undue hardships.”
What? Most of us thought we were home free with all the snow we had in February! Not so.
According to our local newspaper, “Olympic Mountain snowpack was 22 percent of normal Saturday (5/25/19) with three of four automated sensors melted out for the season, according to the U.S. Department of Agriculture.”
June: About a half inch of rain was all we got, which was about half as much as the 30-year average. Temperatures climbed to 82 at one point, with average temperatures several degrees higher than our normal 65. The days grew longer; the wind roared through here at 43 mph, almost matching the record of 45, sucking the land dry. The river often reaches its peak in June; the snow in the mountains all but disappears.
July: I remember years when I wondered if we would even get a summer as it didn’t really warm up until after the 4th of July. This year was a real mix, which seems to be the theme of the 2019 story. We hit the upper 70s (depending on your location) and also dipped to the mid-40s. In addition, we received 0.8” of rain, which seemed most unusual. Winds got up to 37 mph; nothing seemed very predictable; warm one day, cool and breezy the next.
August: “In August, human needs for irrigation water peak, Chinook and Pink salmon return to spawn, the snowpack feeding the river is depleted, and the river drops to its lowest flow. In all but the wettest years with ample snowpack, these low flows are insufficient to meet the needs of salmon, not to mention other competing uses.” That quote from the description of the newly proposed Dungeness off-channel reservoir pretty much sums up what we are up against.
But it was an odd year. We actually received 0.65” of rain in August! It got up to about 80; lows hovered around 50; winds topped 30 and remained above average.
By mid-August, though, the river was still running only 60% of normal. Cooler temps and sporadic rains meant less watering; many plants responded with relief and growth spurts (I’m looking at you, bindweed); but overall, the region remained in a declared drought condition and water conservation measures were urged.
September: By September, our rivers are normally running low and the irrigation ditch network (on which we depend for the garden) is shut off (on September 15) to leave adequate flows for returning salmon. September can also be quite warm, one of our most beautiful months of the year, but that warmth and the low water flows mean higher water temperatures in the river, which are not ideal for fish. This year, to the relief of salmon, a major storm moved through early in the month, and the rivers swelled accordingly. It ended up being one of the wettest Septembers on record. We received a whopping 2.3” at our site, whereas the 30-year average for the area is just 0.83”.
In total, we recorded 19.09” of rain for the water year, nearly 3” above average.
[/su_column][su_column size=”1/3″]


 [/su_column][/su_row]
It has been a roller-coaster water year.
We were fooled at the beginning of the calendar year with incredible snowfall here in the valley, deeper and longer lasting than normal, leading us to believe we would escape the drought and fire hazards of the year before. Then a heat wave in March fooled the trees into blooming early, and a whole lot of that snow ran into the sea, followed by chilling temps that literally nipped the new growth in the bud. Although at times warmer than normal over the summer, we didn’t get the damaging extreme heat that much of the rest of the country experienced. In fact, we even had periods of summer rains, when normally we might get a little drizzle whisked away by the wind, or nothing at all. We were amazed. Our Indian summers are usually quite beautiful, but this September ended up being downright soggy, bringing our water levels back up to normal. I think we are ok with that.
A New Reservoir Plan in Our Future
And now we are into October. The termination dust can be seen across the mountain peaks. We had 3 straight days of an early hard frost, which withered the squash vines and sent me scrambling to harvest what I could. We’ve had some strong winds and a few downpours, but that is all for the next water year story…
The good news for our region is that the County recently received a $4-million grant to build a reservoir that will capture water from the river when the flows are high and distribute them through the irrigation channels when flows get low. Our records show just how vulnerable we are to weather fluctuations when we depend on unreliable mountain snowpack levels for our water supply. We are reminded that, after all, we are living in an area classified as semi-desert, even though we are just an hour or so drive from a rainforest.
The new reservoir will help ensure adequate water for people, farms, and fish, and when abundant, to recharge water aquifers. At least, that’s the idea. Surely, conservation measures will still be a necessity. Will we have water in the irrigation pipes past the September 15 cutoff? I am not sure, but I do know that when the water is running high in the river, we will no longer let it all just rush out to sea (keeping in mind, however, that this water flow is also important to the health of the estuary).
How do we balance all these competing needs?
The new reservoir project is critical for ensuring the sustainability of agriculture in our region and, consequently, the availability of a local food supply, which is no small thing, while also safeguarding four species of threatened and endangered salmon and steelhead.
But I have a feeling it’s not the complete answer.
The fact is, we are in a period of climate change and are likely to experience more climatic extremes in the days to come. How do we prepare? What can we do to help moderate conditions in our gardens and for wildlife? How do we work withnature? What restorative measures can we take to help turn things around for the planet (and for our future survival)? It is more important than ever to contribute to the solution, not the problem.
Making sense of it all…
Understanding the weather and water cycles upon which our lives depend can help us to be better stewards of the land. Granted, we didn’t have near the extremes that people in other parts of the country experienced this last year. Perhaps your story would be much more dramatic. In any event, wherever you are, it appears we are all going to experience more turbulent times ahead.
Where do we go from here?
My questions for you: Do you track the weather and try to spot trends and cycles in the water year? Are you doing anything specifically to prepare for drought, flooding, fire, and dramatic storms? What do you do to increase your resilience, protect your family and your garden (and possibly your food supply), or otherwise even out the extremes?
I firmly believe we can change this trajectory, but it will take each and every one of us. True, a lot of it is out of our control, but there is still much we can do. We need to figure out what that is and then do even more. Perhaps that is for another blog post. For now, understanding what we’re up against is a good first step.
“Where Water Is Wealth” has long been the slogan for our area, based on early pioneer efforts to create the irrigation system over 100 years ago. In today’s light, it takes on a new meaning.
Thanks for joining me,
Blythe
~ * ~
* * *
References and Additional Information:
- Barbolian Fields, Permaculture Journey, Climate Discussion
- CoCoRaHS: (Signing up is free. All it requires is the purchase of a rain gauge, some online training, and an Internet connection.)
- Dungeness Lighthouse Weather Records
- NOAA National Centers for Environmental Information: Climate Information
- Weatherspark
- Western Regional Climate Center
Department of Ecology articles:
- “Drought in Washington 2019.”
- “Inslee expands drought emergency for nearly half of the state.”
- “Olympic Peninsula classified as being in severe drought by federal drought monitor.”
Blogs I Follow:
- Cliff Mass Weather and Climate Blog on current weather, weather prediction, climate issues, and other topics written by UW meteorologist, Cliff Mass.
- The Water Column: written by Ann Soule, hydrogeologist immersed in the Dungeness watershed since 1990, now Resource Manager for City of Sequim.
What I’ve been reading:
- Lancaster, Brad. 2014. Rainwater Harvesting for Drylands and Beyond, Volume 1, Guiding Principles to Welcome Rain into Your Life and Landscape Rainsource Press, Tucson, AZ.
from: Chelsea Green Publishing. (affiliate link) - Nabhan, Gary Paul. 2013. Growing Food in a Hotter, Drier Land. Lessons from Desert Farmers on Adapting to Climate Uncertainty.
from: Chelsea Green Publishing, White River Junction, VT. (affiliate link)
Blythe- I appreciate the time you took to understand “waters” in your area. As a farmer, it becomes second nature to be aware of rainfall or the lack of it. As a naturalist, I’m always checking to see that the birdbaths have a water supply. In my area of southern NY State this year, spring rains were perfect- coming down 1.5″ a week until August. Then we had a shortage of rain and I watched as the creek near me turned into a dry stone bed. Finally in mid October we had 3.5″ of rain over 2 days, bringing everything back to normal. The creek and waterfalls are flowing nicely and all seems right again!
Hi Sandy – I was re-reading your comment and it would be quite amazing to have that kind of rainfall throughout the growing season! It seems we both live in relatively mild areas, although on opposite sides of the country. We were quite thankful for our recent rains to replenish our water table and add to the snow pack in the mountains. I am making sure there is water at the birdfeeders when it dips below freezing. Hope all is well out your way!